
This page exists to answer a question independent of anything that happened to me personally: is there reason to think environmental exposure drives chronic illness at scale? I think it's completely impossible to avoid the truth of the matter anymore.
How much more common chronic illness has become
Chronic illness is no longer the exception in America; it is the norm. By 2023, about three in four American adults reported at least one chronic condition (Watson et al., 2025, shown in the chart below), and chronic conditions now account for most illness, disability and death in the country. Ninety percent of the nation's $5.3 trillion in annual health care spending goes to people with chronic or mental health conditions (CDC).
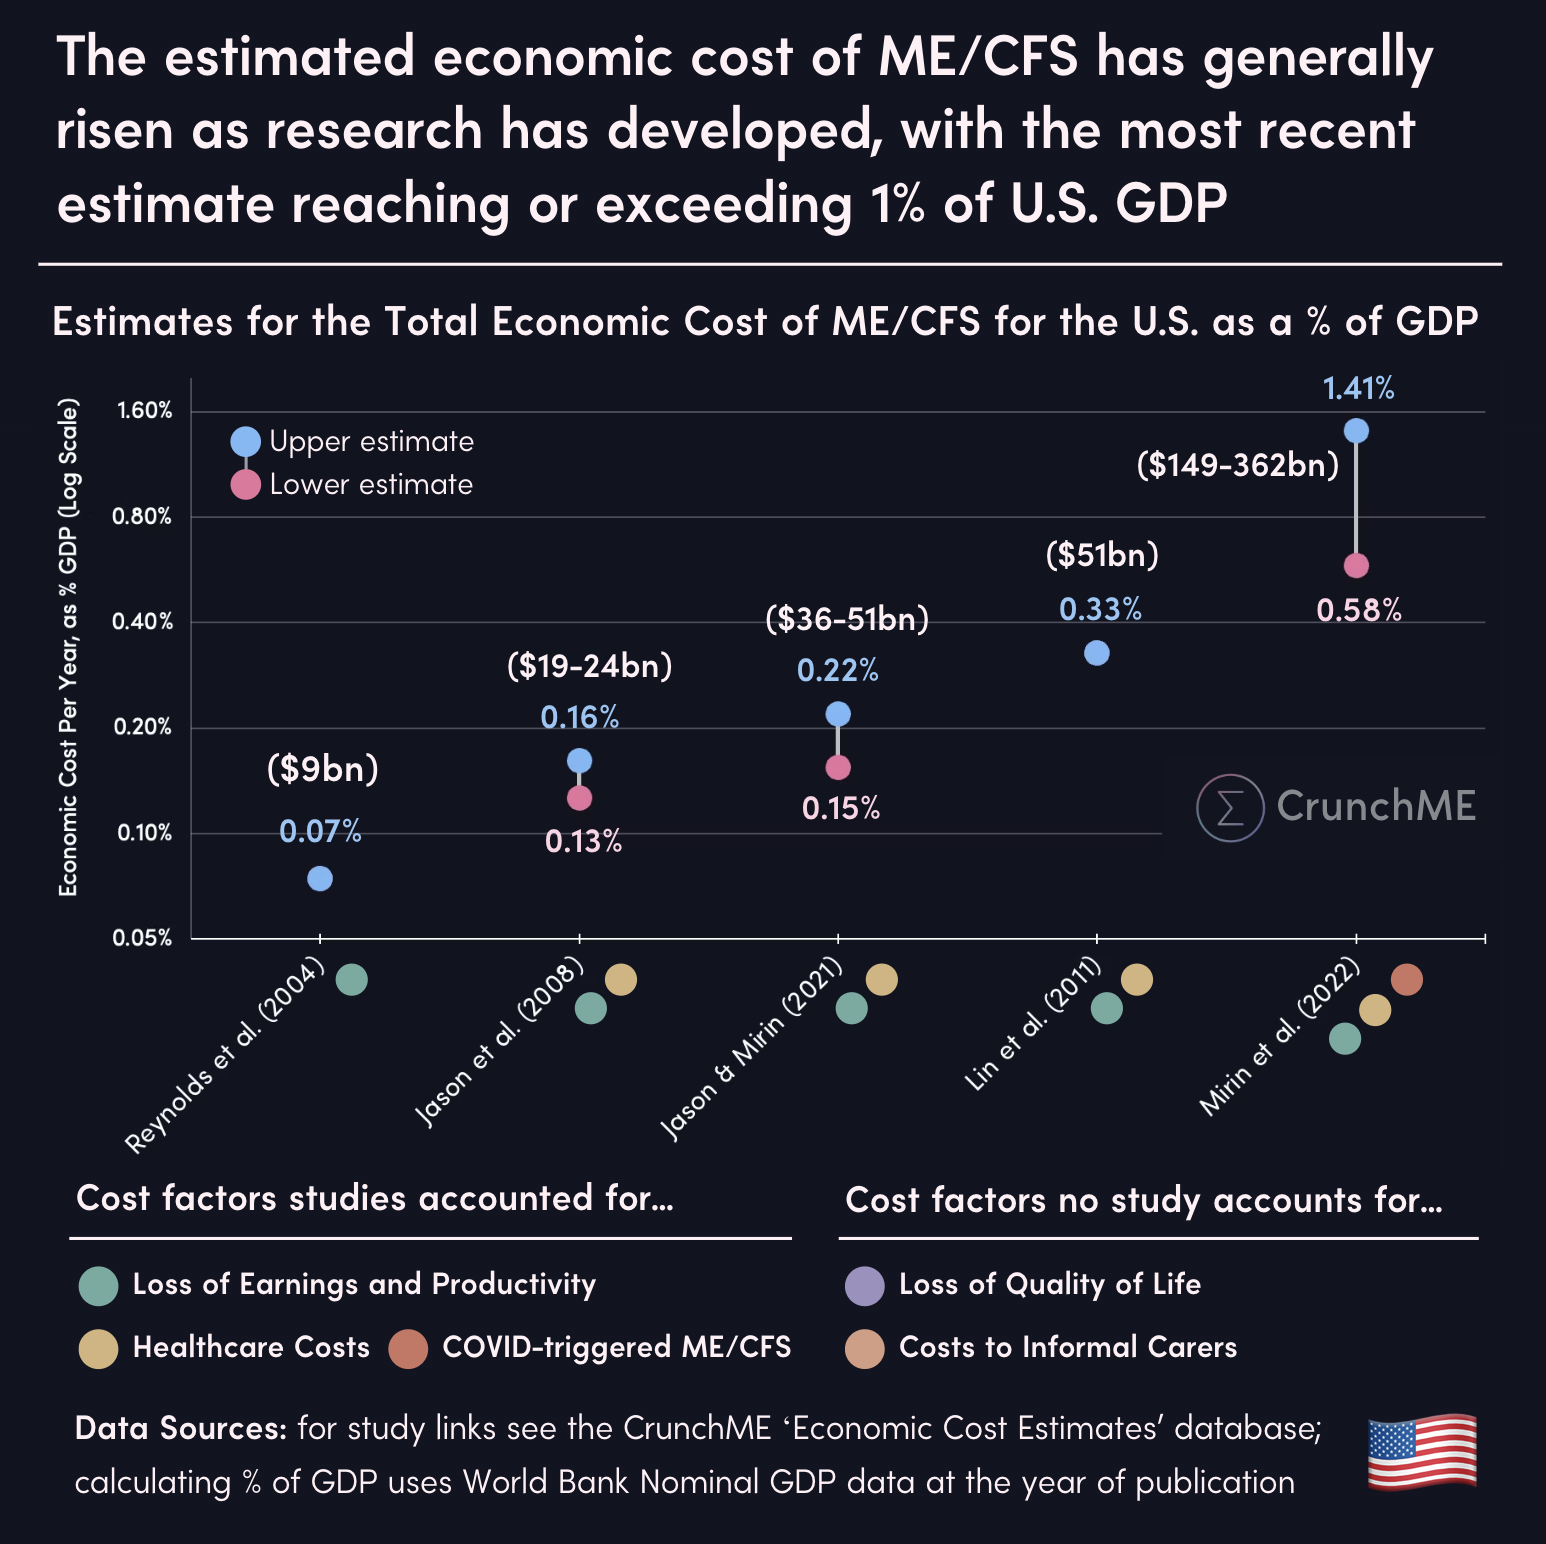
The medical bills are only part of the cost. Counting lost work and productivity, chronic disease cost the U.S. economy an estimated $3.7 trillion in 2016 alone, nearly a fifth of the entire economy (Waters & Graf, Milken Institute, 2018). ME/CFS by itself costs an estimated $36–51 billion a year, much of it in lost earnings, because so many patients can no longer work (Jason & Mirin, 2021), and the total cost of Long COVID has been estimated at $3.7 trillion (Cutler, 2022).
And the rate is rising, a lot and quickly. In the mid-1930s, roughly one in six Americans reported a chronic illness; today it is most adults. Human genetics doesn't change that fast. Something in the way we live has changed over the past hundred years to drive the rate this high, and that is the question the rest of this site is about.
Reported prevalence of chronic illness among Americans, 1935–2023
These six points aren't one continuous survey — they're six separate measurements, from six different sources, using six different methods, taken over 88 years. Three counted the whole population; the other three counted only adults. None of them define "chronic illness" quite the same way. Comparing any two of these numbers directly is comparing apples to a slightly-different apple, and I don't think you should read this chart (C2) as a single clean trend by itself.
The straight line is a genuine statistical trend fit through all six points, anchored to end exactly at the most recent (2023) figure — it's there to show the overall direction, not to claim each point sits exactly where the line does. It doesn't pass through the other five points, and it isn't supposed to.
The 1935–36 point is the same National Health Survey already cited below as the source of the 7.5% figure — shown here unfiltered (the raw "more than one in six" count), rather than run through the 45%-true-prolonged-illness filter that produces 7.5%. It's one source, not two.
The 2000 figure is back-calculated: Partnership for Solutions reported 125 million Americans with a chronic condition, not a percentage — the ~44% here is that count divided by the 2000 Census population, not something the original report stated directly.
The most solid pair on this chart is 2013 and 2023: same paper, same 12-condition BRFSS methodology, ten years apart, nothing else changed. If you want the one comparison here I'd actually stand behind as apples-to-apples, that's it — a rise from 72.3% to 76.4% of U.S. adults in a single decade, using one consistent measure.
The rest of the page explains why an aging population and improving medicine don't account for a rise this size. This chart is here to establish that the rise itself isn't just an artifact of one bad measurement — it shows up, in some form, in six independent attempts to count it, across nine decades of very different survey methods.
How these figures compare
The 1935 figure (7.5%) is derived, not directly reported: the original survey found 23 million Americans — more than one in six — with some chronic disease, orthopedic impairment, or serious defect of hearing or vision, of whom, on Weisz's reading of the underlying reports, only about 45% had true prolonged illness (three months or more of disability) rather than something milder or transient (National Health Survey, Bulletin 6, 1938/rev. 1939, p. 12; cited in Weisz, 2011). The two figures are not a like-for-like comparison: 1935 surveyed households in 19 states, not a national sample; it counted the whole population, where 2023 counts adults only; and it used a disability-duration threshold, where 2023 counts 12 named chronic conditions by phone survey (BRFSS). The direction of change is not in doubt — the size of the gap is partly an artifact of definition.
A roughly tenfold rise in reported chronic illness over ninety years, even accounting for definitional drift, is not what you'd expect if the underlying biology of the population were static and the only thing that changed was diagnosis. Something in the environment people live in has to be part of that story.
A common objection is that this is just demographics: fewer infants dying and people living longer means more people surviving into the ages where chronic illness is common, not that the population has actually gotten sicker. I don't think the numbers support that as a sufficient explanation. US infant mortality fell from roughly 100 per 1,000 births in the 1910s to about 6 per 1,000 today, and life expectancy at birth rose from about 47 years to about 79 over the twentieth century (CDC/NCHS, 2020). But even in the extreme case where every single one of those additional infant survivors went on to develop a chronic illness, that alone could only shift population-wide prevalence by a matter of single-digit percentage points — nowhere near the roughly 69-point rise the 1935-to-now comparison shows. And most of that 32-year gain in life expectancy reflects fewer deaths in infancy and childhood, not adults living dramatically longer once they'd already reached adulthood — someone who survived to 20 in 1900 already had a real chance of living into old age. An aging population plausibly explains some of the rise. It does not explain a tenfold one.
The same problem shows up from the other direction. Over the same century, medicine gained pharmaceuticals, surgical technique, diagnostic imaging and lab testing, sanitation and hygiene, and nutrition science that didn't exist in 1935. If anything, that should have pushed chronic illness rates down, or at least held them flat against a growing and aging population — not let them rise tenfold alongside it. Whatever is driving this rise is outpacing everything medicine has gained across the same period.
How neglected complex chronic illness is
For how common and how disabling these illnesses are, they receive remarkably little attention. About 1.3% of U.S. adults, roughly 3.3 million people, had ME/CFS in 2021–2022 (Vahratian et al., NCHS Data Brief No. 488, 2023) (C3), and the National Academy of Medicine estimated that as many as 84–91% of people with ME/CFS have never been diagnosed (Institute of Medicine, 2015). That puts it on a par with epilepsy (C3).
People with ME/CFS are more limited in their physical functioning than people with lung disease, osteoarthritis, heart disease, rheumatoid arthritis, cancer, diabetes or depression (C4).
Research funding hasn't come close to matching that burden. Measured against disability-adjusted life years, the standard measure of disease burden, ME/CFS receives less NIH funding relative to its burden than any other disease studied: roughly a fourteenth of what its burden would warrant (Mirin, Dimmock & Jason, 2020). Inflammatory bowel disease and asthma, with comparable burdens, each received more than ten times as much. Measured against what its burden would warrant, NIH's annual shortfall for ME/CFS was about $189 million before the pandemic, and may be as much as $458 million today (C5).


ME/CFS costs more healthy years of life in the US each year than Parkinson's disease, HIV, multiple sclerosis and type 1 diabetes (CrunchME). Yet it has had only 54 registered US clinical trials, against 784–1,438 for each of those comparison diseases (CrunchME), and only 157 worldwide, against 1,781–3,785 for each (C6).
Recent estimates put its total cost to the US economy at $149–362 billion a year, up to about 1.4% of GDP (C7).
Long COVID, which often looks the same, now affects an estimated 14–17 million American adults, 5–6% of the adult population, according to the CDC's Household Pulse Survey (C8).


Multiple chemical sensitivity is even more neglected. In a nationally representative survey, 25.9% of U.S. adults reported being sensitive to everyday chemical exposures, and 12.8% reported a medical diagnosis of MCS — increases of over 200% and 300% respectively in about a decade. Among those with MCS, 76% reported disabling health effects from fragranced products, and 61% had lost workdays or a job in the past year because of fragranced products in the workplace (Steinemann, 2018). Despite that, MCS has no category of its own in NIH's public research-funding reports, and there is no dedicated federal research program for it.
Weighing The Root Causes of Disease
When we look for what is driving this rise, there are only three places the root cause of a disease can come from: genetics (what we inherit), the environment (what we're exposed to), and infection, which is really part of the environment but is often treated separately. Every chronic illness comes down to some mix of the three. The rest of this page weighs how much each one plausibly contributes to complex chronic illness: genetics in this section, environment in the sections on our homes and on precedent in other diseases, and infection in the section on viral persistence.
Genetics can't explain the rise itself. Chronic illness has gone from about one in six Americans to most adults in under a century, far faster than the genetic makeup of a population can change. And for ME/CFS specifically, the genetic contribution has now been measured, and it is small. DecodeME, the largest genetic study of ME/CFS to date, found that common genetic variants explain only about 9.5% of the risk of developing it (DecodeME Collaboration, 2025). That is in the same range as asthma (about 10%), arthritis (about 12%) and type 2 diabetes (about 13%), none of which anyone considers primarily genetic, and nowhere near a strongly genetic risk like the APOE4 variant in Alzheimer's disease. Put another way, about nine out of ten of the reasons one person develops ME/CFS and another doesn't are not explained by the common DNA differences the study measured.
The eight genetic regions the study identified each shift risk only slightly, by roughly 7–8%. The variants in those regions are common: they turned up in about 15% to 65% of people with ME/CFS, but also in 14% to 63% of people without it, usually a difference of only one or two percentage points. Huge numbers of healthy people carry the same variants, and huge numbers of patients don't. The findings are useful for pointing to which body systems are involved in risk, but they are not strong predictors of who gets sick. As Jack Hadfield, an ME/CFS and Long COVID researcher and co-founder of Amatica Health, put it, the recent genetic findings “rather prove it is not primary genetic disease” (Hadfield, 2026; Hadfield, 2025).
If inherited risk explains so little of who gets sick, and nothing in our genes changed fast enough to explain the rise, then most of the explanation has to lie elsewhere. That makes it far more likely that the environmental component is large.
One pattern points toward the environment from a different angle. Both ME/CFS and Long COVID become sharply less common after about age 65. If these illnesses were driven by something that builds up with age, the opposite should be true. My suspicion is that this is a birth-cohort or period effect: something about the environment a person was born into or grew up with, rather than a biological effect of aging. I don't have a specific exposure to point to yet, and this is speculation I haven't tested.
What changed in our homes
Most people's exposure to the environment is really exposure to their indoor environment. Americans spend around 90% of their time indoors, and the air in that indoor space is not simply a diluted version of the air outside — the EPA's Total Exposure Assessment Methodology (TEAM) studies found roughly a dozen common organic pollutants at concentrations 2 to 5 times higher indoors than outdoors, in both rural and heavily industrial areas alike, and up to 1,000 times higher for a period during and after activities like paint stripping (C9).
Five of the riskiest air pollutants in US homes, compared with outdoor air
Naphthalene home 0.9 · outdoor 0.1 µg/m³
Formaldehyde home 18 · outdoor 2.5 µg/m³
Chloroform home 1.2 · outdoor 0.2 µg/m³
1,3-Butadiene home 0.3 · outdoor 0.1 µg/m³
Benzene home 2.1 · outdoor 1.8 µg/m³
Typical levels, not worst cases. Naphthalene values come from different studies than the other four.
Source: Loh et al., Environ Health Perspect, 2007 (compiled US exposure studies)
The chemical and material environment inside a home is not what it was a few decades ago either, and the scale of that change is measurable, not anecdotal. More than 350,000 distinct chemicals and mixtures are now registered for production and use worldwide — up to three times more than earlier estimates had found, once national inventories were compared against each other directly for the first time.
Labeling doesn't fully capture it, either. A 2026 nontargeted chemical analysis of 113 personal care and cleaning products — including many marketed as "natural," "non-toxic" or "organic" — found that 98% contained at least one chemical not disclosed on the label, 85% contained at least one chemical with a known or suspected health hazard, and products averaged 51 detected chemicals against 16 listed. You cannot avoid an exposure you don't know is there.
Cleaning products have been measured against a benchmark most people would recognize. In a European cohort of more than 6,000 adults followed for over 20 years, women who cleaned at home, or who cleaned for a living, lost lung function faster than women who did not clean — a decline the authors likened to smoking 20 cigarettes a day for 10 to 20 years. Asthma was more common in both cleaning groups (12.3% at home, 13.7% at work) than among women who did not clean (9.6%) (Svanes et al., Am J Respir Crit Care Med, 2018).
Plastics tell a similar story. As of 2015, 8,300 million metric tons of virgin plastic had been produced since mass manufacturing began, most of it within the preceding two decades. Of the 6,300 Mt that had already become waste, only 9% had ever been recycled; 12% was incinerated; the remaining 79% was sitting in landfills or loose in the environment. Production has not slowed since — global output doubled again between 2000 and 2019, to 460 Mt a year, and waste generation more than doubled over the same period, to 353 Mt, with the recycled share still stuck at around 9% (C10).
Clothing carries its own exposure. PFAS ("forever chemicals") have been detected in the majority of school uniforms tested across North America, cotton included, applied for stain and water resistance. Separately, a 2025 Consumer Reports investigation tested 23 popular protein powders and shakes and found more than two-thirds carried more lead in a single serving than their food-safety experts consider safe for an entire day — some by more than tenfold, with plant-based powders the worst offenders, since plants draw heavy metals up from soil as they grow.
This is not an abstraction happening somewhere else. A 2022 Dutch study analyzing blood from 22 anonymous, healthy volunteers found microplastic particles in 17 of them — about 77% — with polyethylene terephthalate (PET, used in bottles and food packaging), polystyrene and polyethylene among the types detected. Whatever is accumulating in the home environment is not staying in the home environment; it is already circulating in most people's bloodstream, healthy or not.
It is in the brain, too, and the amount is rising. A 2025 study examined decedent brain tissue and found microplastic and nanoplastic concentrations in 2024 samples running well above 2016 samples from the same tissue bank — roughly 50% higher — with brains carrying markedly more plastic, gram for gram, than liver or kidney from the same donors (C11). Brains from decedents with a dementia diagnosis carried the heaviest loads of all, though the study is explicit that this is a correlation, not proof that the plastic caused the dementia.
And it may not be inert once it's there. In a 2024 study, 304 patients undergoing carotid endarterectomy had their removed arterial plaque tested for microplastics and nanoplastics — found in almost 60% of them, polyethylene most commonly. Over roughly three years of follow-up, patients whose plaque contained detectable plastic had 4.5 times the rate of heart attack, stroke or death from any cause compared with patients whose plaque didn't (C12). The authors are clear that this doesn't prove the plastic caused the events — but a 4.5-times difference is not a subtle signal.
None of this proves an environmental cause for ME/CFS specifically. What it establishes is narrower but load-bearing for the case as a whole: the volume, diversity and durability of what off-gasses, sheds and accumulates in the spaces people spend nearly all their time in has grown enormously within a single generation, in a direction that adds exposure rather than removing it. Titanium dioxide, the particle the model focuses on, is one strand of that story — it is the whitening pigment in most matte white paint, itself a comparatively recent, low-cost building material.
Precedent in other diseases
An environmental root cause is not a fringe idea in medicine generally. It is becoming the accepted explanation for several diseases that were, until recently, treated as having no clear cause — and none of the six below involve allergy, immune dysfunction or chemical sensitivity as a diagnostic feature, which is exactly the objection I hear most about applying this kind of explanation to ME/CFS.
-
of familial Alzheimer's brain tissues had aluminum above 3.00 µg/g dry weight, the level considered pathologically significantMold et al., J Alzheimers Dis 2020
Alzheimer's disease
Brain tissue from patients with familial Alzheimer's showed aluminum — a neurotoxic metal with no known biological role in the body — co-located with amyloid-beta plaques at a very high rate, including inside the plaques themselves.
-
the risk of developing Parkinson's disease compared with their unexposed twinGoldman et al., Ann Neurol 2012
Parkinson's disease
In a study of twin pairs where only one twin had occupational exposure to trichloroethylene, a solvent used in dry cleaning and degreasing, the exposed twin had roughly six times the risk of developing Parkinson's disease that their unexposed twin had. A separate 2025 nationwide study of more than 1.1 million older Medicare beneficiaries found long-term exposure to trichloroethylene in outdoor air was independently associated with higher Parkinson's risk — the same chemical, now showing up at ambient, not just occupational, exposure levels.
-
the odds of Lewy body dementia per 5 µg/m³ more PM2.5 (aOR 3.70, 95% CI 2.69–5.10)JAMA Netw Open 2026
Lewy body and Parkinson's-related dementia
A 2026 study of more than 2.1 million people in Denmark found that higher long-term exposure to fine particulate air pollution and nitrogen dioxide was associated with sharply higher risk of Lewy body dementia — the pattern was stronger for Lewy body dementia than for Parkinson's-related dementia, but present for both.
-
the microplastic particles per gram of stool compared with healthy controls (41.8 vs 28.0 items/g dry mass)Yan et al., Environ Sci Technol 2022
Inflammatory bowel disease
Patients with IBD had significantly more microplastic particles in their stool than healthy controls, and more severe symptoms correlated with a higher microplastic count. (I've seen this cited elsewhere as an IBS finding — it's IBD; the two get conflated a lot and I don't want to pass that along.)
-
prevalence odds ratio for the interaction between PON1 genotype and nerve agent alarm exposureHaley et al., Environ Health Perspect 2022
Gulf War illness
A 2022 gene-environment study found that veterans with low-level exposure to sarin nerve gas were significantly more likely to develop Gulf War illness — and specifically veterans carrying the weaker variant of PON1, the gene that detoxifies nerve agents. That gene-by-environment pattern is considered strong evidence of causation, not just correlation.
-
decline in sperm counts over roughly 46 yearsLevine et al., Hum Reprod Update 2023
Male fertility
A 2023 meta-analysis covering samples collected worldwide from the 1970s onward found sperm counts had fallen by more than half over roughly 46 years, with the rate of decline more than doubling since 2000. The list of suspected drivers is overwhelmingly environmental: endocrine-disrupting chemicals, pesticides and microplastics among them.
Each of these was, for decades, filed under "cause unknown" or attributed to genetics alone. In each case the actual driver turned out to be an environmental exposure interacting with the person's own biology — which is the same structure of claim the model makes about ME/CFS. None of it is evidence for my specific mechanism. It's evidence that the general shape of the argument — an environmental exposure producing a disease that looks, on the surface, unrelated to environment — keeps turning out to be right elsewhere in medicine.
What about viral persistence?
An infection is, by a wide margin, the most common thing patients report before ME/CFS or Long COVID begins — millions of people trace their illness back to a specific virus, and I'm not disputing that or asking anyone to. Viral persistence is real: some viruses do stay active in the body longer than expected, and for some patients that is almost certainly part of what's happening. What I don't think holds up is persistence as the explanation for who stays sick.
The split between “environmental” and “viral” is not as clean as it sounds. In lung lymph nodes from 84 non-smoking organ donors aged 11 to 93, inhaled particulates built up with age — the nodes are beige in children and black by middle age — and the immune cells holding those particles were measurably worse at engulfing anything else and at signaling the rest of the immune system (Ural et al., Nat Med, 2022). A lifetime of ordinary air changes how well the body answers an infection.
Here is the problem it doesn't solve. Two people are infected in the same outbreak, sometimes the same household, with what is by any measure the same virus. One recovers in two weeks. The other is bedbound a year later. If persistence of the original pathogen were what determined the outcome, you would expect it to track with who got sick and how badly — and the data consistently doesn't show that.
A blinded two-year study followed 425 people — 167 with Long COVID, 148 who had fully recovered, and 110 who were never infected — testing their blood for SARS-CoV-2 protein at 6–12 months and again at 18–24 months. Protein turned up in the Long COVID group somewhat more often early on, but also in a fifth of the people who had completely recovered, and by two years it had faded to nearly nothing in every group — while plenty of people in the Long COVID group were still sick (C13). Detectable protein was not associated with symptom severity, antibody levels, or vaccination status.
The same pattern shows up elsewhere. A German study led by Carmen Scheibenbogen — one of the most active ME/CFS and Long COVID researchers in Europe — tested serum from 121 post-COVID patients, 72 of whom met ME/CFS criteria, for spike protein up to two years out. It turned up in about 10% of them, but at the same rate in healthy people, with no connection to symptom severity — "unlikely to play a role in ME/CFS," in her own words. A separate Stanford study screened blood from ME/CFS patients and healthy controls for 185 different human viruses and found the opposite of what a persistence model would predict (C14).
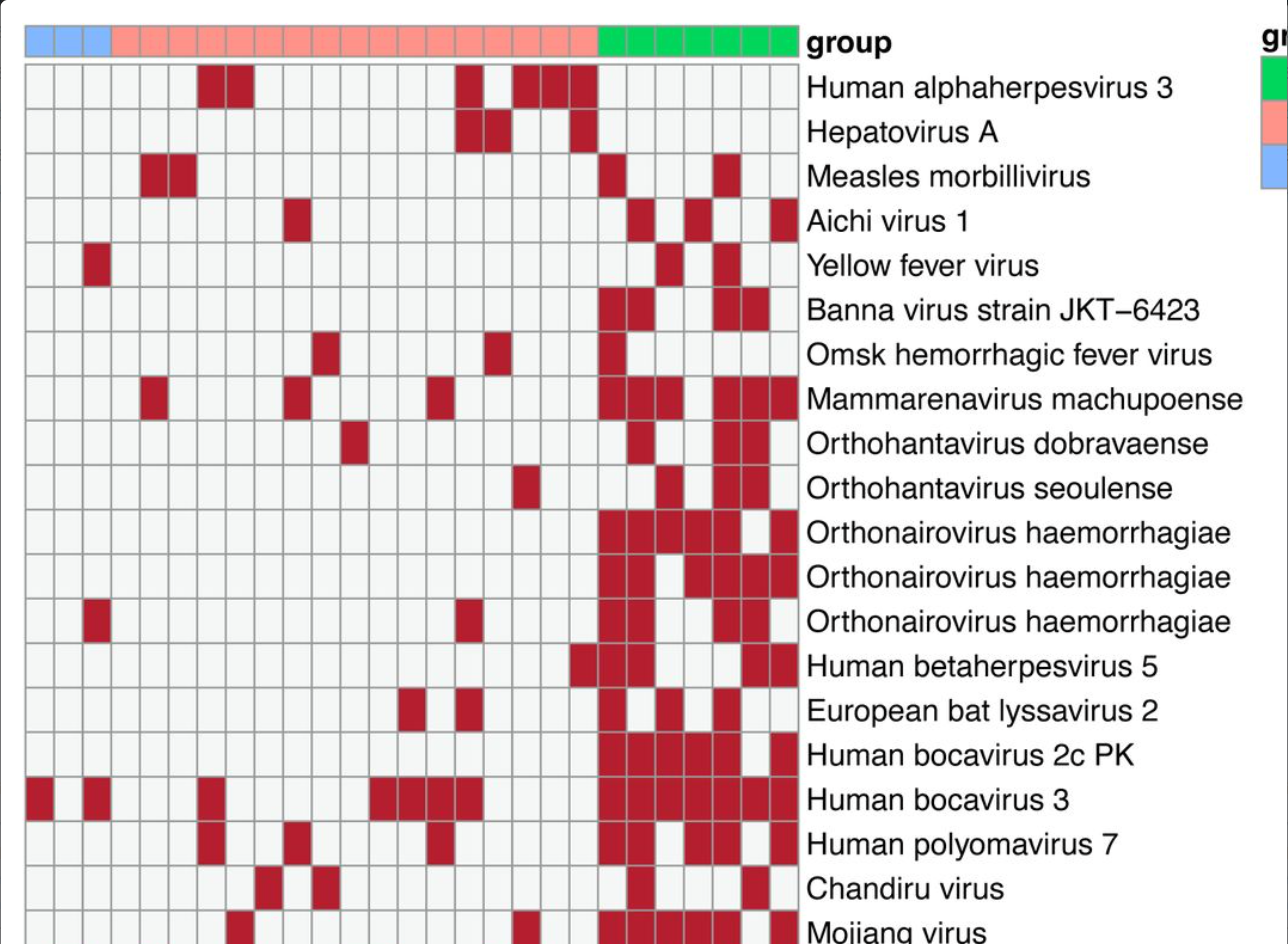
More viral genetic material detected in healthy controls than in ME/CFS patients, across 17 viruses found in a 185-virus screening panel. No virus was found in all or even most ME/CFS samples.
A third line of evidence comes from treatment. If persistent spike protein were driving symptoms, clearing it should help. A 2026 study gave tixagevimab/cilgavimab, antibodies that bind the spike protein, to ten immunodeficient patients with Long COVID–associated ME/CFS and detectable circulating spike, nine of whom were followed up (Seidel et al., 2026). After 30 days, spike levels fell in five of the nine, but the change across the group was not significant (median 63 to 26 pg/ml, p = 0.63), and none of the assessed clinical outcomes changed significantly at group level. Changes in spike didn't track changes in any of the measured autoantibodies either. The authors are clear that this is preliminary: nine patients, no untreated control group, only 30 days of follow-up, and only immunodeficient patients. And because the antibodies didn't reliably clear the spike, the study can't fully test whether removing it would help. But it adds to the pattern: wherever spike protein is measured against how sick people are, the two don't move together.
Other treatment trials targeting persistence have not fared better. An antiviral trial of Paxlovid for Long COVID found no benefit over placebo (Geng et al., JAMA Intern Med, 2024), and three of the first five Long COVID trials in the NIH's RECOVER program to report results found no significant improvement over placebo. A UCSF trial of a monoclonal antibody aimed at clearing residual virus, presented at the 2025 PolyBio Long COVID Symposium, didn't move the needle on symptoms either — leading the study's own lead investigator to say the approach might be less promising than many had hoped. One Long COVID patient I spoke with, who had been on a monoclonal antibody herself and did see some benefit, put it this way: "I feel like it just delayed a path I was already headed down."
It's worth being precise about what I'm disputing. I separate the initiator (the virus or exposure that starts the disease state) from the driver (what sustains it). Weighted by duration against an acute infection's viral load, a low-level persistence running for years works out to roughly half the biological impact of the original infection: meaningful, but not obviously enough to explain a static disease state on its own. Viral persistence hasn't been ruled out, but the evidence for it as the driver is weak.
It also helps to remember how much microbial material a healthy body carries anyway. About 8% of the human genome is derived from ancient retroviruses. Mitochondria have their own genome because they were once bacteria coexisting with a eukaryotic cell. The colon alone holds roughly 38 trillion bacterial cells, about as many as the body's own cells (Sender et al., PLoS Biol, 2016). Around 30% of the population is infected with Toxoplasma gondii, which forms cysts in brain and muscle. Nearly everyone is infected with EBV and HHV-6, which infect brain, epithelial and immune cells. And healthy people show COVID antigen persistence too. So while spike protein persistence very likely has some degree of biological impact, having it is not immediately pathological — it is one research avenue among the many credible mechanisms Long COVID needs analyzed.
That detail matters more than it first looks: mono, flu and Lyme are caused by unrelated pathogens — a herpesvirus, an influenza virus, a bacterium — that have nothing biologically in common with each other, let alone with SARS-CoV-2. If persistence of the specific pathogen were the driver, there's no reason those four completely different infections should produce a recognizably similar chronic illness afterward. A shared vulnerability in the person, rather than something shared between the pathogens, fits what's actually been observed a great deal better.
None of this means the virus was irrelevant. It means the virus was very often the initiator, not the driver — the event that started the damage, not the thing that has to keep circulating to sustain it. That distinction matters clinically: a mouse model of long-term post-COVID neurological deficits found the damage persisted for at least 60 days after the virus itself had become undetectable in the brain, the same pattern already documented in hamsters, where upper respiratory tract tissue stayed inflamed and epithelial cells kept dying for months after the infectious virus itself was gone (Liu et al., 2026). Barrier damage shows up directly in patients too: in one study, every Long COVID patient tested had impaired nasal epithelial barrier function, including near-total loss of occludin, one of the core proteins holding the tight junctions between epithelial cells together, compared with healthy controls (Baalbaki et al., 2026). Damage that outlasts its trigger is a very different thing from an infection that never cleared, and it's the pattern this model expects — an exposure, viral or chemical, damages a barrier, and the barrier stays damaged.

Asked to distinguish a toxic-injury trigger from a viral one, Dr. Klimas, who has researched ME/CFS for decades, said that clinically, she can't (C15).
That is the same ambiguity this whole page is about: illness that looks viral-onset can still have an environmental toxin doing the work, because the clinical picture doesn't tell you which one you're looking at.
COVID directly affects respiratory tissue, so damage from the virus lands on the respiratory epithelial barrier — the barrier that keeps out common, airborne contaminants. That includes abrasive nanoparticles like titanium dioxide, which can cause connective tissue damage and blood vessel leakage; fibers like microplastics, which can clog lymphatics; mold and mycotoxins, which can cause malaise; and VOCs, which can perpetuate that barrier damage and prevent recovery. This explains both the strong heterogeneity in symptoms and why some people develop Long COVID and others don't.

I know people who have had COVID five, six, seven times and are healthy and working full time, and I know people who caught it once and developed Long COVID. Only a minority of infected people go on to develop Long COVID, so what is different about them?
The usual answer is “it's just genetics.” Some genetic associations have been found, but they are weak and explain only a small part of who gets sick (see Weighing The Root Causes of Disease, above). Cases like C16 show why genetics alone can't be the answer: two brothers, the same bug a day apart, and only one developed ME/CFS. Something besides the genes and the infection decides who goes on to develop a chronic illness.
The genetics fit the same picture. FOXP4's involvement in lung disease is in being a transcription factor that regulates epithelial cell differentiation — the same type of cell destroyed by COVID infections, and the same type of cell that protects the human body from airborne contaminants.
So why does the same virus, in the same outbreak, leave one person fine and another disabled? A persistence model has no answer, because persistence isn't reliably different between the two. A susceptibility model does: some barriers were more compromised going in, by whatever a person's own exposure history happened to be, environmental included. That is also why an infection-triggered illness doesn't rule out an environmental contribution. The two aren't competing explanations: one is often what tips a barrier over the edge, and the other is what decided how close to the edge it already was.
Are environmental exposures a problem for people with ME/CFS?

One exception to the rule stated at the top of this page, that everything here is independent published research rather than my own observation: I don't know of a published, controlled study measuring how often people with ME/CFS also report environmental or chemical sensitivities, so the figure below is mine, not the literature's. Across three informal polls I ran in Facebook patient support groups, about 80% of people with ME/CFS self-report chemical or environmental sensitivities (C17). Given that I had no idea for four years that environment was involved in my own case, I suspect the true figure is higher still.
Self-reported overlap: chemical sensitivity, CFS/ME, MCS and EDS
CHRONIC ILLNESS in CHEMICAL SENSITIVITY
Groups defined by a chronic illness, asked whether they also have chemical sensitivities
“for those who have CFS here, do you also have environmental/chemical sensitivities?”
80%(54 yes votes)
“how many people here self identify as having chemical sensitivities of some degree?”
92%(220 yes votes)
CHEMICAL SENSITIVITY in CHRONIC ILLNESS
The reverse direction: a group defined by chemical sensitivity, asked whether they also have chronic fatigue/ME-CFS
“for those with Multiple Chemical Sensitivity, do you identify as also having chronic fatigue or ME/CFS?”
72%(32 yes votes)
Source: three self-selected Facebook support-group polls, not a scientific survey.
A poll about chemical sensitivity posted in a support group is answered disproportionately by people who have it — these figures are likely inflated and shouldn't be read as prevalence estimates.
References
These are the published studies the model draws on. They are real and independent of me; the synthesis and the application to ME/CFS are my own.
- Davydow DS, Pontone GM, Okun MS, et al. Exposure to air pollutants and Lewy body and Parkinson disease–related dementias. JAMA Netw Open. 2026;9(5):e2612601. ↩ ↩
- Krzyzanowski B, Beyene KM, Turner JR, Racette BA. Ambient trichloroethylene exposure and Parkinson disease risk in Medicare beneficiaries. Neurology. 2025;105(8):e214174. ↩
- Nihart AJ, Garcia MA, El Hayek E, et al. Bioaccumulation of microplastics in decedent human brains. Nat Med. 2025;31(4):1114–19. ↩
- Marfella R, Prattichizzo F, Sardu C, et al. Microplastics and nanoplastics in atheromas and cardiovascular events. N Engl J Med. 2024;390(10):900–10. ↩
- Levine H, Jørgensen N, Martino-Andrade A, et al. Temporal trends in sperm count: a systematic review and meta-regression analysis of samples collected globally in the 20th and 21st centuries. Hum Reprod Update. 2023;29(2):157–76. ↩ ↩
- Leslie HA, van Velzen MJM, Brandsma SH, Vethaak AD, Garcia-Vallejo JJ, Lamoree MH. Discovery and quantification of plastic particle pollution in human blood. Environ Int. 2022;163:107199. ↩ ↩
- Haley RW, Kramer G, Xiao J, Dever JA, Teiber JF. Evaluation of a gene-environment interaction of PON1 and low-level nerve agent exposure with Gulf War illness. Environ Health Perspect. 2022;130(5):057001. ↩ ↩
- Yan Z, Liu Y, Zhang T, Zhang F, Ren H, Zhang Y. Analysis of microplastics in human feces reveals a correlation between fecal microplastics and inflammatory bowel disease status. Environ Sci Technol. 2022;56(1):414–21. ↩ ↩
- Livingston G, Huntley J, Sommerlad A, et al. Dementia prevention, intervention, and care: 2020 report of the Lancet Commission. Lancet. 2020;396(10248):413–46. ↩
- Mold M, Linhart C, Gómez-Ramírez J, Villegas-Lanau A, Exley C. Aluminum and amyloid-β in familial Alzheimer's disease. J Alzheimers Dis. 2020;73(4):1627–35. ↩ ↩
- Leso V, Fontana L, Romano R, Gervetti P, Iavicoli I. Artificial stone associated silicosis: a systematic review. Int J Environ Res Public Health. 2019;16(4):568. ↩
- Hedström AK, Hössjer O, Katsoulis M, Kockum I, Olsson T, Alfredsson L. Organic solvents and MS susceptibility: interaction with MS risk HLA genes. Neurology. 2018;91(5):e455–62. ↩
- Lanphear BP, Rauch S, Auinger P, Allen RW, Hornung RW. Low-level lead exposure and mortality in US adults: a population-based cohort study. Lancet Public Health. 2018;3(4):e177–84. ↩
- Chen H, Kwong JC, Copes R, et al. Living near major roads and the incidence of dementia, Parkinson's disease, and multiple sclerosis: a population-based cohort study. Lancet. 2017;389(10070):718–26. ↩
- Cohn BA, La Merrill M, Krigbaum NY, et al. DDT exposure in utero and breast cancer. J Clin Endocrinol Metab. 2015;100(8):2865–72. ↩
- Wesseling C, Crowe J, Hogstedt C, Jakobsson K, Lucas R, Wegman DH. The epidemic of chronic kidney disease of unknown etiology in Mesoamerica: a call for interdisciplinary research and action. Am J Public Health. 2013;103(11):1927–30. ↩
- Loomis D, Grosse Y, Lauby-Secretan B, et al. The carcinogenicity of outdoor air pollution. Lancet Oncol. 2013;14(13):1262–3. ↩
- Goldman SM, Quinlan PJ, Ross GW, et al. Solvent exposures and Parkinson disease risk in twins. Ann Neurol. 2012;71(6):776–84. ↩ ↩
- Grandjean P, Andersen EW, Budtz-Jørgensen E, et al. Serum vaccine antibody concentrations in children exposed to perfluorinated compounds. JAMA. 2012;307(4):391–7. ↩
- C8 Science Panel. Probable Link Reports. 2011–2012; see also Barry V, Winquist A, Steenland K. Perfluorooctanoic acid (PFOA) exposures and incident cancers among adults living near a chemical plant. Environ Health Perspect. 2013;121(11-12):1313–8. ↩
- Tanner CM, Kamel F, Ross GW, et al. Rotenone, paraquat, and Parkinson's disease. Environ Health Perspect. 2011;119(6):866–72. ↩
- Ferraro PM, Costanzi S, Naticchia A, Sturniolo A, Gambaro G. Low level exposure to cadmium increases the risk of chronic kidney disease: analysis of the NHANES 1999–2006. BMC Public Health. 2010;10:304. ↩
- Herbstman JB, Sjödin A, Kurzon M, et al. Prenatal exposure to PBDEs and neurodevelopment. Environ Health Perspect. 2010;118(5):712–9. ↩
- McConnell R, Islam T, Shankardass K, et al. Childhood incident asthma and traffic-related air pollution at home and school. Environ Health Perspect. 2010;118(7):1021–6. ↩
- Navas-Acien A, Silbergeld EK, Pastor-Barriuso R, Guallar E. Arsenic exposure and prevalence of type 2 diabetes in US adults. JAMA. 2008;300(7):814–22. ↩
- Izbicki G, Chavko R, Banauch GI, et al. World Trade Center “sarcoid-like” granulomatous pulmonary disease in New York City Fire Department rescue workers. Chest. 2007;131(5):1414–23. ↩
- Grandjean P, Landrigan PJ. Developmental neurotoxicity of industrial chemicals. Lancet. 2006;368(9553):2167–78. ↩
- Lee DH, Lee IK, Song K, et al. A strong dose-response relation between serum concentrations of persistent organic pollutants and diabetes: results from NHANES 1999–2002. Diabetes Care. 2006;29(7):1638–44. ↩
- Darby S, Hill D, Auvinen A, et al. Radon in homes and risk of lung cancer: collaborative analysis of individual data from 13 European case-control studies. BMJ. 2005;330(7485):223. ↩
- Swan SH, Main KM, Liu F, et al. Decrease in anogenital distance among male infants with prenatal phthalate exposure. Environ Health Perspect. 2005;113(8):1056–61. ↩
- IARC Working Group. Formaldehyde. IARC Monogr Eval Carcinog Risks Hum. 2006;88:1–478. ↩
- Pope CA 3rd, Burnett RT, Thun MJ, et al. Lung cancer, cardiopulmonary mortality, and long-term exposure to fine particulate air pollution. JAMA. 2002;287(9):1132–41. ↩
- Kreiss K, Gomaa A, Kullman G, Fedan K, Simoes EJ, Enright PL. Clinical bronchiolitis obliterans in workers at a microwave-popcorn plant. N Engl J Med. 2002;347(5):330–8. ↩
- Racette BA, McGee-Minnich L, Moerlein SM, Mink JW, Videen TO, Perlmutter JS. Welding-related parkinsonism: clinical features, treatment, and pathophysiology. Neurology. 2001;56(1):8–13. ↩
- Smith AH, Lingas EO, Rahman M. Contamination of drinking-water by arsenic in Bangladesh: a public health emergency. Bull World Health Organ. 2000;78(9):1093–103. ↩
- Dockery DW, Pope CA 3rd, Xu X, et al. An association between air pollution and mortality in six U.S. cities. N Engl J Med. 1993;329(24):1753–9. ↩
- Rier SE, Martin DC, Bowman RE, Dmowski WP, Becker JL. Endometriosis in rhesus monkeys (Macaca mulatta) following chronic exposure to 2,3,7,8-tetrachlorodibenzo-p-dioxin. Fundam Appl Toxicol. 1993;21(4):433–41. ↩
- Cardis E, Kesminiene A, Ivanov V, et al. Risk of thyroid cancer after exposure to 131I in childhood. J Natl Cancer Inst. 2005;97(10):724–32. ↩
- Langston JW, Ballard P, Tetrud JW, Irwin I. Chronic Parkinsonism in humans due to a product of meperidine-analog synthesis. Science. 1983;219(4587):979–80. ↩
- Needleman HL, Gunnoe C, Leviton A, et al. Deficits in psychologic and classroom performance of children with elevated dentine lead levels. N Engl J Med. 1979;300(13):689–95. ↩
- Infante PF, Rinsky RA, Wagoner JK, Young RJ. Leukaemia in benzene workers. Lancet. 1977;2(8028):76–8. ↩
- Bertazzi PA, Consonni D, Bachetti S, et al. Health effects of dioxin exposure: a 20-year mortality study. Am J Epidemiol. 2001;153(11):1031–44. ↩
- Creech JL Jr, Johnson MN. Angiosarcoma of liver in the manufacture of polyvinyl chloride. J Occup Med. 1974;16(3):150–1. ↩
- Herbst AL, Ulfelder H, Poskanzer DC. Adenocarcinoma of the vagina: association of maternal stilbestrol therapy with tumor appearance in young women. N Engl J Med. 1971;284(16):878–81. ↩
- Jacobsen M, Rae S, Walton WH, Rogan JM. New dust standards for British coal mines. Nature. 1970;227(5257):445–7. ↩
- Nogawa K, Kobayashi E, Okubo Y, Suwazono Y. Environmental cadmium exposure, adverse effects and preventive measures in Japan. Biometals. 2004;17(5):581–7. ↩
- Acheson ED, Cowdell RH, Hadfield E, Macbeth RG. Nasal cancer in woodworkers in the furniture industry. BMJ. 1968;2(5605):587–96. ↩
- Wagner JC, Sleggs CA, Marchand P. Diffuse pleural mesothelioma and asbestos exposure in the North Western Cape Province. Br J Ind Med. 1960;17(4):260–71. ↩
- Erasmus LD. Scleroderma in gold-miners on the Witwatersrand with particular reference to pulmonary manifestations. S Afr J Lab Clin Med. 1957;3(3):209–31. ↩
- Harada M. Minamata disease: methylmercury poisoning in Japan caused by environmental pollution. Crit Rev Toxicol. 1995;25(1):1–24. ↩
- Doll R. Mortality from lung cancer in asbestos workers. Br J Ind Med. 1955;12(2):81–6. ↩
- Case RAM, Hosker ME, McDonald DB, Pearson JT. Tumours of the urinary bladder in workmen engaged in the manufacture and use of certain dyestuff intermediates in the British chemical industry. Br J Ind Med. 1954;11(2):75–104. ↩
- Doll R, Hill AB. Smoking and carcinoma of the lung: preliminary report. BMJ. 1950;2(4682):739–48. ↩
- Hardy HL, Tabershaw IR. Delayed chemical pneumonitis occurring in workers exposed to beryllium compounds. J Ind Hyg Toxicol. 1946;28:197–211. ↩
- Martland HS, Humphries RE. Osteogenic sarcoma in dial painters using luminous paint. Arch Pathol. 1929;7:406–17. ↩
- Watson KB, Wiltz JL, Nhim K, Kaufmann RB, Thomas CW, Greenlund KJ. Trends in Multiple Chronic Conditions Among US Adults, By Life Stage, Behavioral Risk Factor Surveillance System, 2013–2023. Prev Chronic Dis. 2025;22:E15. ↩ ↩ ↩
- Centers for Disease Control and Prevention. Fast Facts: Health and Economic Costs of Chronic Conditions. ↩
- Waters H, Graf M. The Costs of Chronic Disease in the U.S. Milken Institute; 2018. ↩
- Jason LA, Mirin AA. Updating the National Academy of Medicine ME/CFS prevalence and economic impact figures to account for population growth and inflation. Fatigue Biomed Health Behav. 2021;9(1):9–13. ↩
- Cutler DM. The economic cost of Long COVID: an update. Harvard University working paper, July 2022. ↩
- Weisz G. Epidemiology and health care reform: the National Health Survey of 1935–1936. Am J Public Health. 2011;101(3):438–47. ↩
- National Center for Health Statistics. Current Estimates from the Health Interview Survey, United States, July 1962–June 1963. Vital and Health Statistics, Series 10, No. 5. PHS Publication No. 1000. Washington, DC: US Government Printing Office; 1964. ↩
- Anderson G, Horvath J. Chronic Conditions: Making the Case for Ongoing Care. Partnership for Solutions, Johns Hopkins University and Robert Wood Johnson Foundation; 2002. ↩
- Buttorff C, Ruder T, Bauman M. Multiple Chronic Conditions in the United States. Santa Monica, CA: RAND Corporation; 2017. TL-221. ↩
- National Health Survey. Preliminary Reports, Bulletin 6: The Magnitude of the Chronic Disease Problem in the United States. Washington, DC: National Health Survey; 1938 (revised 1939). ↩
- Vahratian A, Lin J-MS, Bertolli J, Unger ER. Myalgic encephalomyelitis/chronic fatigue syndrome in adults: United States, 2021–2022. NCHS Data Brief, No. 488. 2023. ↩
- Institute of Medicine. Beyond Myalgic Encephalomyelitis/Chronic Fatigue Syndrome: Redefining an Illness. National Academies Press; 2015. ↩
- Mirin AA, Dimmock ME, Jason LA. Research update: The relation between ME/CFS disease burden and research funding in the USA. Work. 2020;66(2):277–82. ↩
- CrunchME. Visuals. CC BY 4.0. ↩ ↩ ↩ ↩ ↩ ↩ ↩ ↩
- Steinemann A. National prevalence and effects of multiple chemical sensitivities. J Occup Environ Med. 2018;60(3):e152–e156. ↩
- DecodeME Collaboration. Initial findings from the DecodeME genome-wide association study of myalgic encephalomyelitis/chronic fatigue syndrome. medRxiv. 2025. ↩
- Hadfield J. Posts on X, August 6, 2025 and April 22, 2026. ↩ ↩
- Klepeis NE, Nelson WC, Ott WR, et al. The National Human Activity Pattern Survey (NHAPS): a resource for assessing exposure to environmental pollutants. J Expo Anal Environ Epidemiol. 2001;11(3):231–52. ↩
- US Environmental Protection Agency. The Inside Story: A Guide to Indoor Air Quality. EPA 402-K-93-007 (Total Exposure Assessment Methodology studies). ↩
- Loh MM, Levy JI, Spengler JD, Houseman EA, Bennett DH. Ranking cancer risks of organic hazardous air pollutants in the United States. Environ Health Perspect. 2007;115(8):1160–1168. ↩
- Wang Z, Walker GW, Muir DCG, Nagatani-Yoshida K. Toward a global understanding of chemical pollution: a first comprehensive analysis of national and regional chemical inventories. Environ Sci Technol. 2020;54(5):2575–84. ↩
- Schultz K, Rochester JR, Kupec Lathrop M, et al. Hidden hazards: nontargeted chemical analysis reveals widespread contaminants and mislabeling in personal care and cleaning products. Environment & Health. 2026. ↩
- Geyer R, Jambeck JR, Law KL. Production, use, and fate of all plastics ever made. Sci Adv. 2017;3(7):e1700782. ↩
- OECD. Global Plastics Outlook: Economic Drivers, Environmental Impacts and Policy Options. Paris: OECD Publishing; 2022. ↩
- Xia C, Diamond ML, Peaslee GF, et al. (Peaslee G, senior author). Per- and polyfluoroalkyl substances in North American school uniforms. Environ Sci Technol. 2022;56(19):13845–57. ↩
- Consumer Reports. Protein powders and shakes contain high levels of lead. Investigative testing of 23 products, October 2025. ↩
- Mateu L, Hansen LL, Carmezim JP, et al. Blinded 2-year longitudinal evaluation of SARS-CoV-2 antigenemia in Long COVID. Clin Microbiol Infect. 2026;32(9):1487–94. ↩
- Fehrer A, Sotzny F, Kim L, et al. Serum spike protein persistence post COVID is not associated with ME/CFS. J Clin Med. 2025;14(4):1086. ↩
- Hyman RW, Xu W, Roy KR, Suresh S, St Onge RP, Davis RW. Virus genome sequences in the blood of myalgic encephalomyelitis/chronic fatigue syndrome patients. medRxiv. 2025. ↩
- Seidel M, Anft M, Wiemers L, et al. Exploratory clinical and immunological changes following Tixagevimab/Cilgavimab administration in immunodeficient patients with SARS-CoV-2-associated ME/CFS and persistent circulating spike protein. Immunol Lett. 2026;107247. ↩
- Geng LN, Bonilla H, Hedlin H, et al. Nirmatrelvir-ritonavir and symptoms in adults with postacute sequelae of SARS-CoV-2 infection: the STOP-PASC randomized clinical trial. JAMA Intern Med. 2024;184(9):1024–1034. ↩
- NIH RECOVER Initiative. Long COVID clinical trial results (RECOVER-TLC and related trials), as reported in Ladyzhets B. Three RECOVER trials share results, all show no significant improvement over placebo. The Sick Times. 13 May 2026. ↩
- PolyBio Research Foundation. Spring 2025 Long COVID Symposium — M. Peluso (UCSF), UCSF monoclonal antibody trial results, as reported in Ladyzhets B. The Sick Times. 16 May 2025. ↩
- Sender R, Fuchs S, Milo R. Revised estimates for the number of human and bacteria cells in the body. PLoS Biol. 2016;14(8):e1002533. ↩
- Ruiz-Casas C, Tarrés-Freixas F, Roca N, et al. Persistent neurological and behavioral alterations after SARS-CoV-2 infection in an optimized K18-hACE2 mouse model. Front Microbiol. 2026;17:1871084. ↩
- Liu F, Xia Y, Lee ACY, et al. Prolonged dysregulation and pathological changes in the upper respiratory tract of SARS-CoV-2 infected hamsters. npj Viruses. 2026;4:15. ↩
- Baalbaki N, van Egmond D, Jaeger P, et al. Barrier dysfunction in nasal epithelium contributes to persistent inflammation in long COVID. J Allergy Clin Immunol. 2026;157(1):203–16. ↩